Latency SLOs on ALBs
One very popular metric on which to set a goal using as SLO is request latency. The request latency of this TargetGroup corresponds to the responsiveness of this web application, as measured server side at the load balancer. This is a pretty good place to set an SLO. Of course you might choose to set other kinds of SLOs at other pulse points, but this ALB TargetGroup technique has some advantages:
- Nothing extra needs to be instrumented on the application (such as Real User Monitoring or the like)
- This metric measures real traffic “in the wild” (as opposed to, say, a synthetic such as AWS Canaries)
- It’s easy to locate this metric and instrument it on any ALB TargetGroup
The other techniques we mention have their place, of course, depending on what you want to measure and how. But for now let’s set a latency SLO for this traffic.
Getting to the Metric
To navigate to the metric from the TargetGroup:
- Click on the Monitoring tab
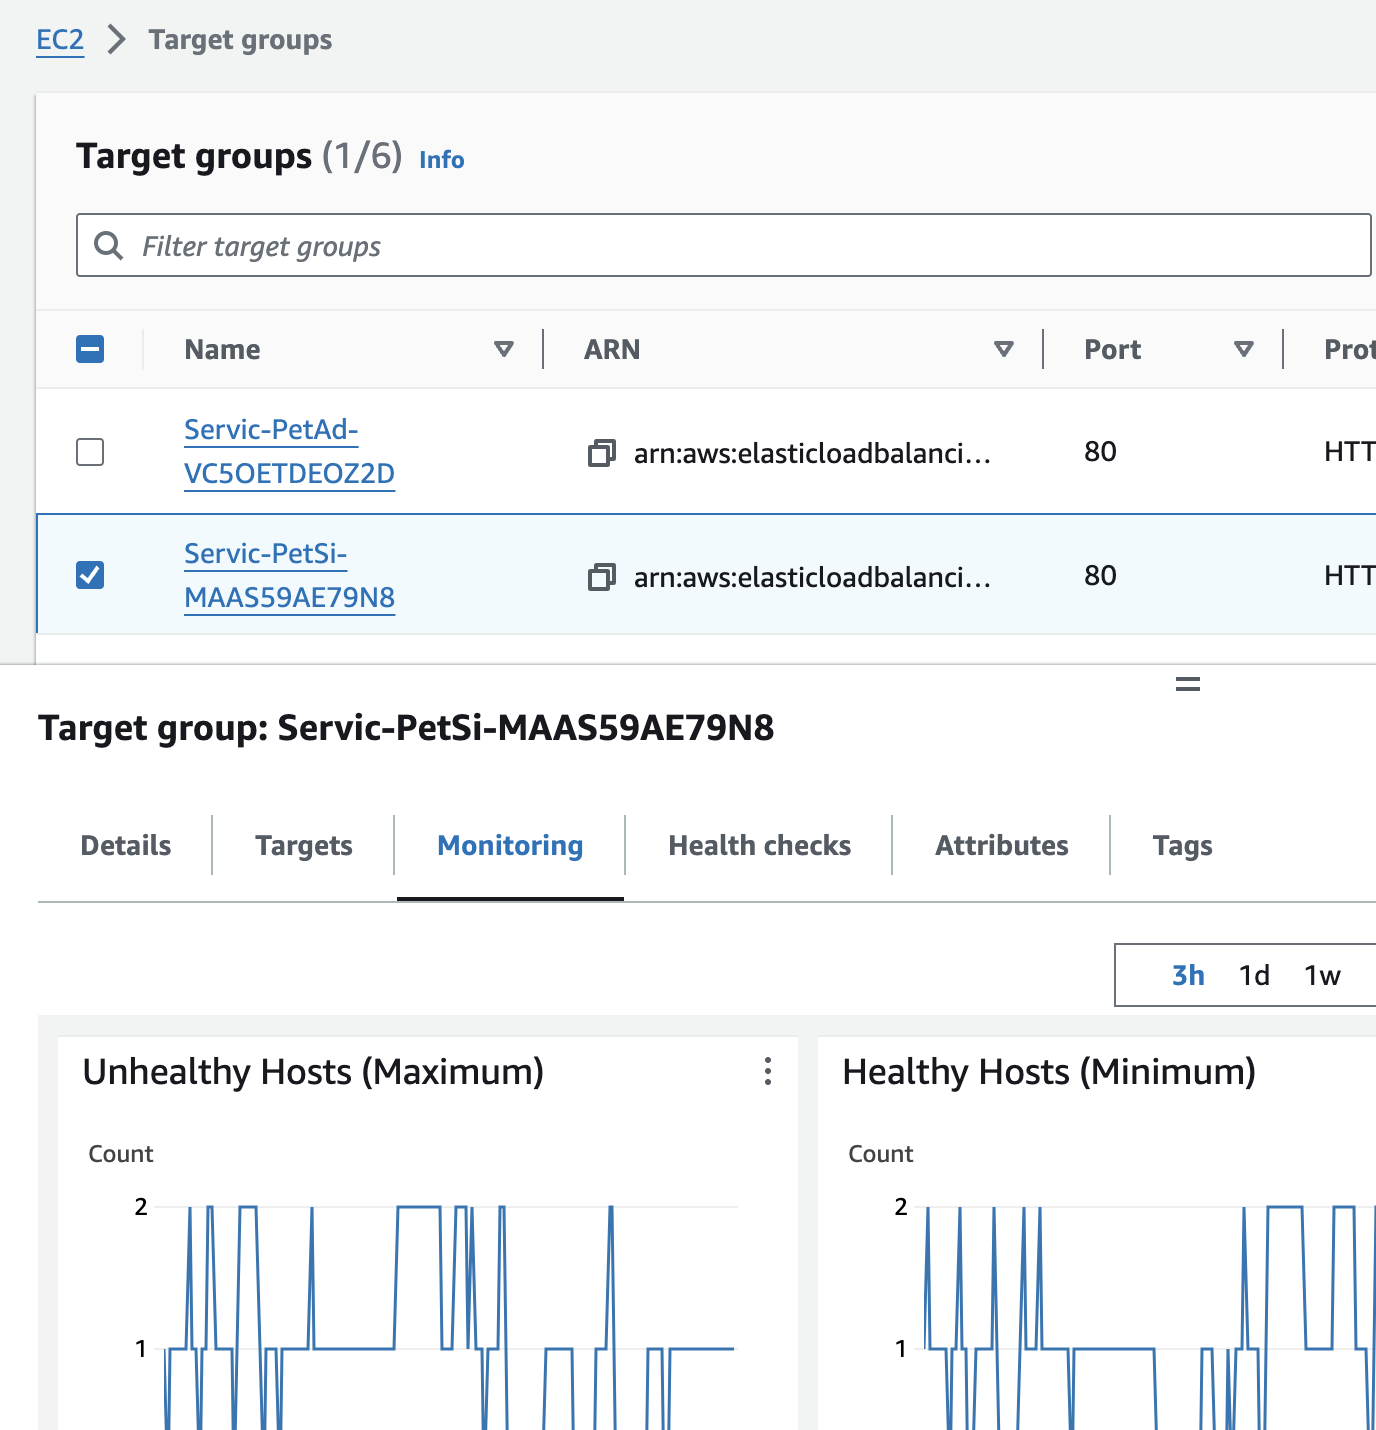
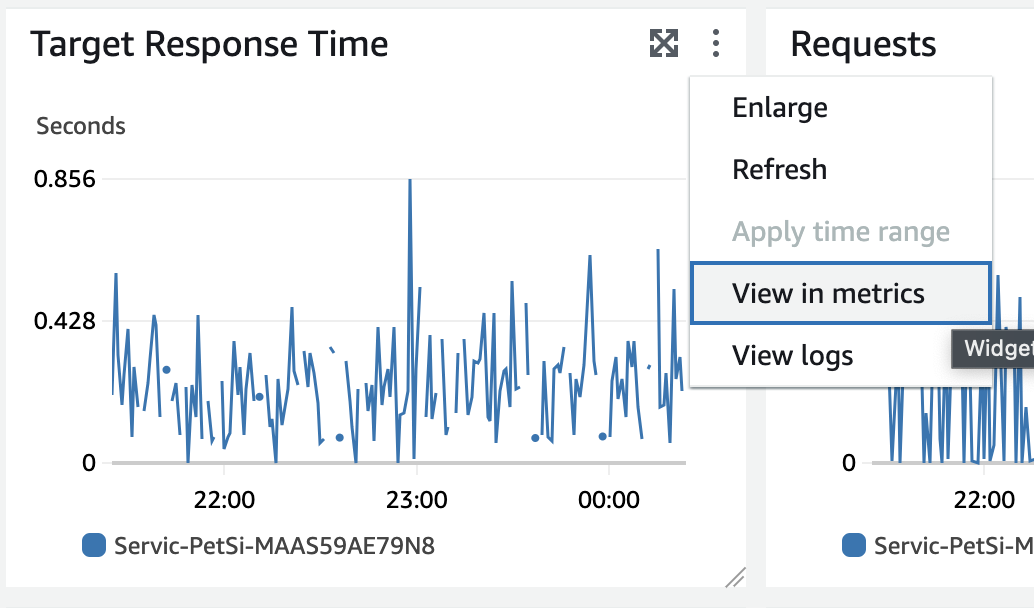
- Locate the pane called Target Response Time
- Click on the three dots action menu and select “View in metrics”
- On the CloudWatch Metrics screen, click the pencil icon to open Edit details
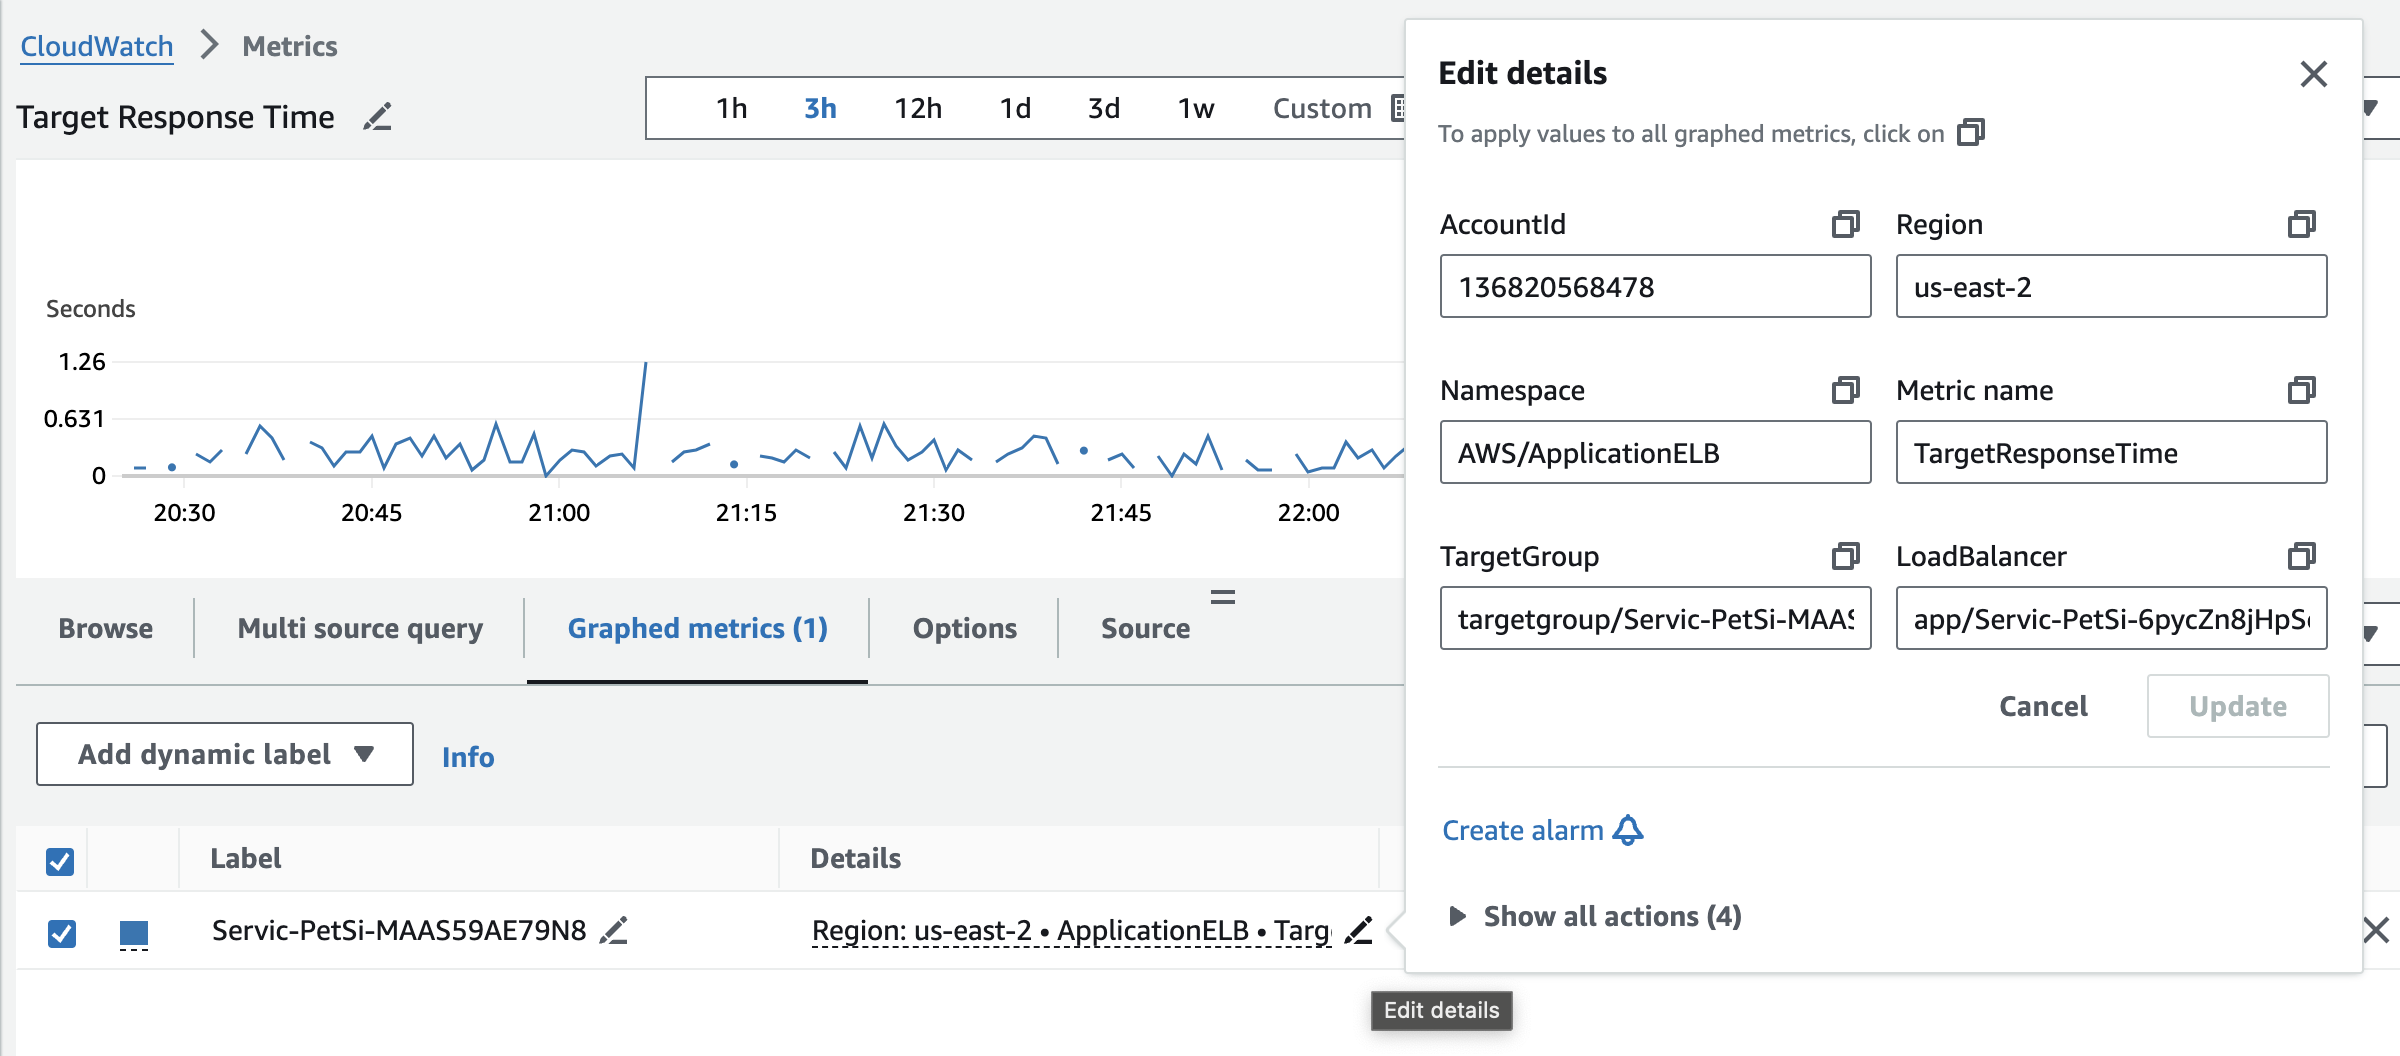 These are the metric settings you can copy and paste into Nobl9. Leave this tab open while we set up the SLO.