Now that you’ve identified the SLI and Threshold, let’s create an SLO on this and give it an error budget.
Creating an SLO from SLI Analyzer
-
On the bottom of the SLI Analysis, click Create SLO
-
Select the PetSite-FrontEnd service you created earlier
-
Click on 2 Select data source and metric
- All of this information is pre-populated from the SLI Analysis
-
Click on 3 Define time window
- Nobl9 has a lot of flexibility to address real-world SLO use cases. For example, if you want to track an SLO that mirrors a contractual SLA, you may want to base it on the language in the contract. Most SLAs are defined on a calendar month, traditionally, but it can vary depending on the needs of the business. Or maybe you want to track reliability alongside quarterly revenue. Or maybe you’d like to use a rolling window, because recent behavior over a trailing time period is more important to your business and operations than what day of the week or month it is.
- Nobl9’s default here is a 28-day rolling window, which is long enough for useful planning – almost a month – but contains the same number of weekend days no matter when you look at it, making it more stable than a 30-day window.
-
Click on 4 Define error budget calculation and objectives
- Let’s stick with Occurrences for calculation unless we have a specific reason to prefer Time Slices
- Enter a Display name that describes the failure mode of this SLO, because it may show up on an alert.
- Let’s go with
Slow response time
- Let’s go with
- Leave the rest of this unchanged, as it was populated from the SLI Analysis
-
Click on 5 Add name, alert policy, and labels
- Enter a Display name describing the whole SLO
- Let’s go with
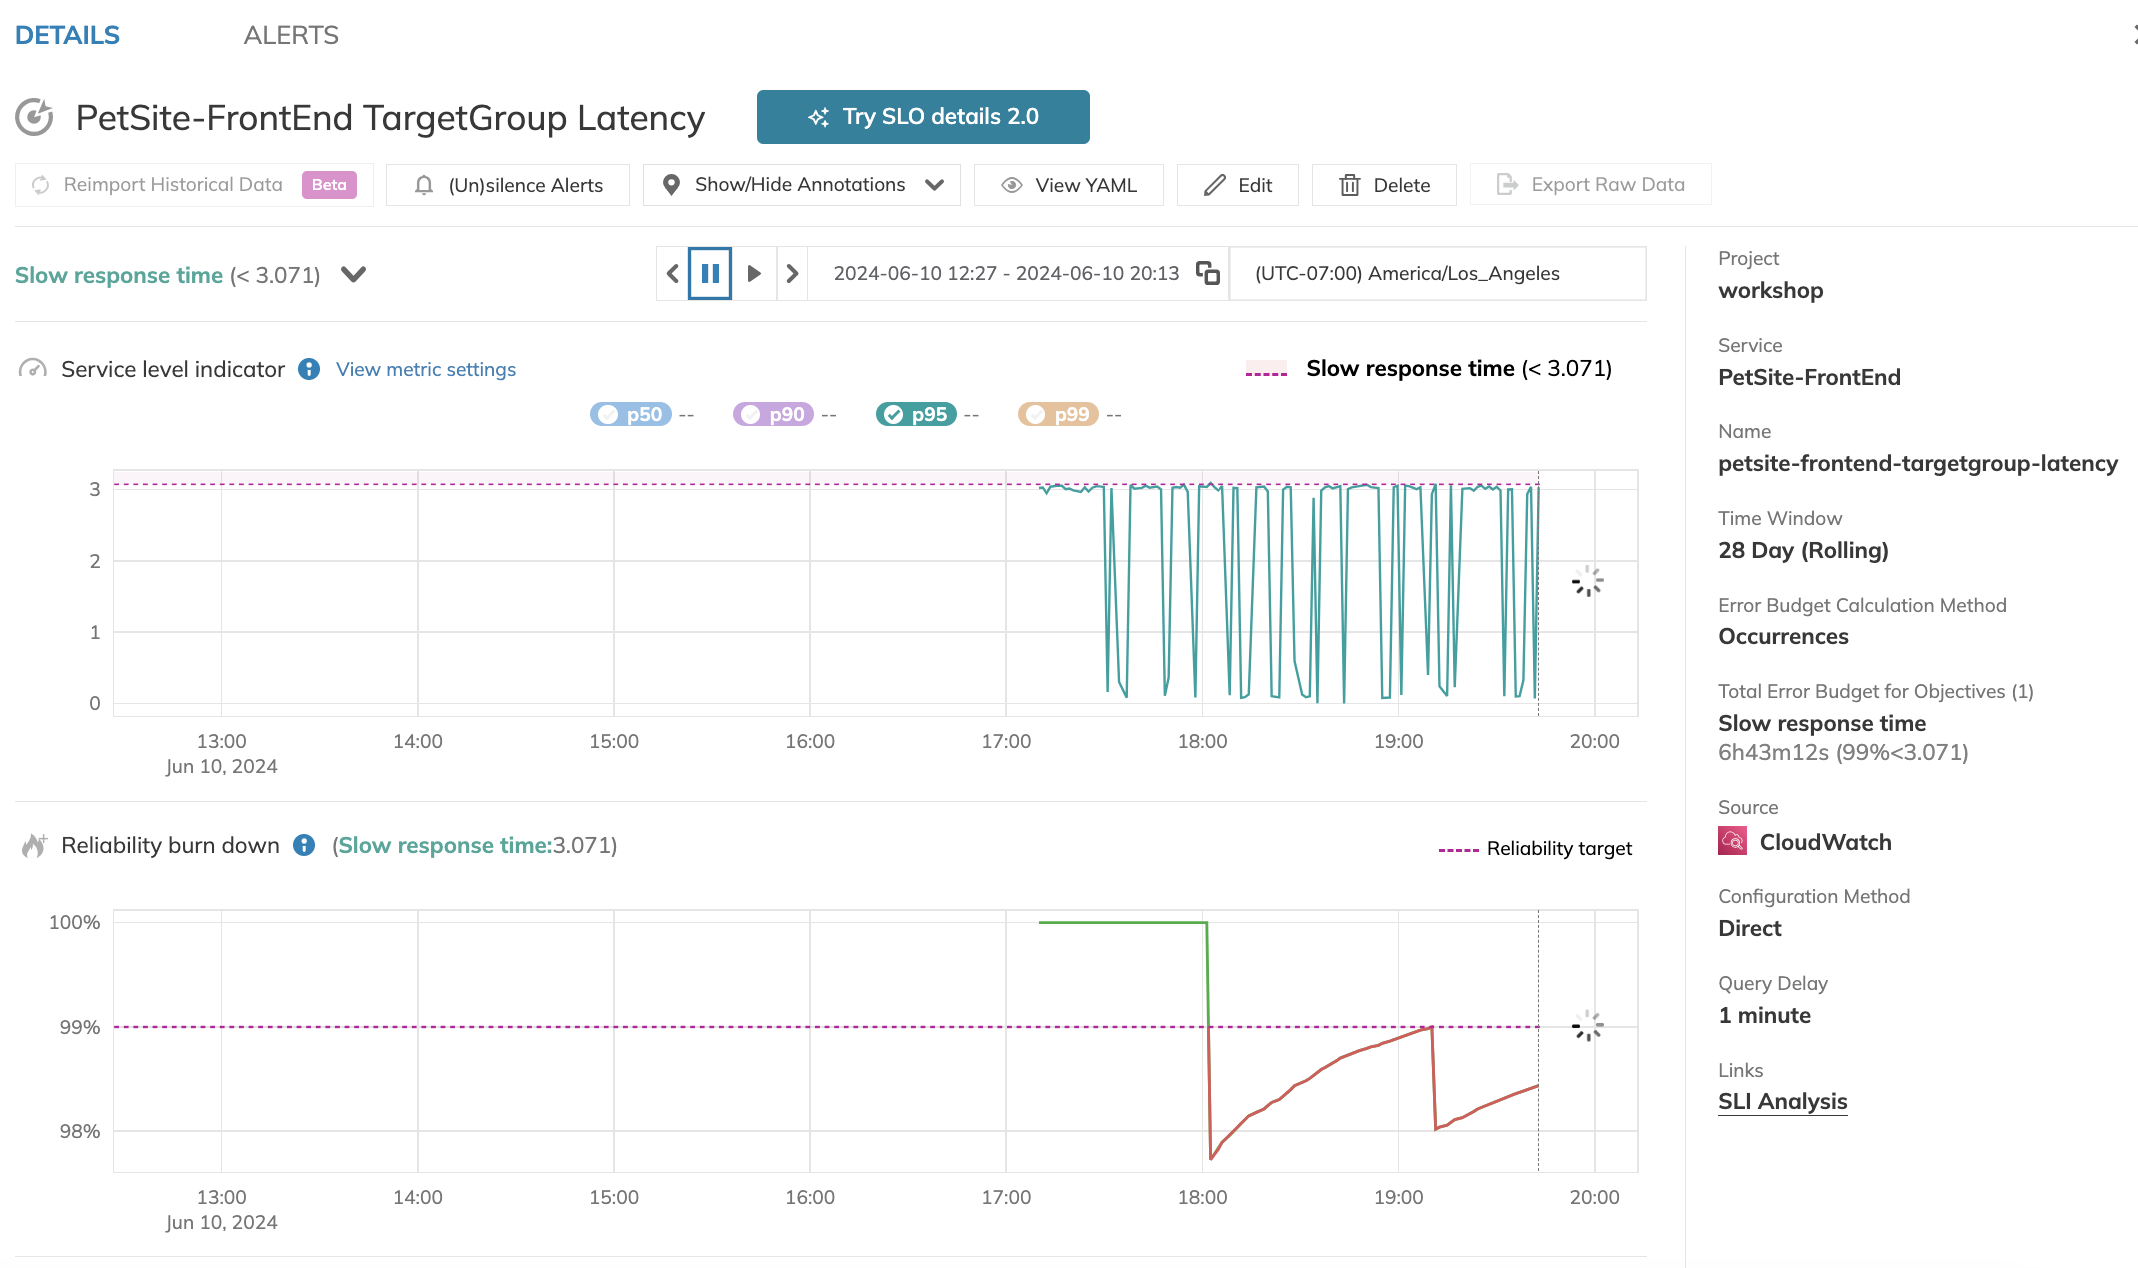
PetSite-FrontEnd TargetGroup Latency
- Let’s go with
- Enter a Display name describing the whole SLO
- Click Create SLO
If you’d like, you can now click on Reimport Historical Data to bring in, say, an hour’s worth of data, so that the SLO starts with similar data as your SLI Analysis.