Working with Latency
Nobl9 has a powerful back-testing capability called SLI Analyzer. Let’s use this feature to help us create an SLO using a latency threshold based on the recent performance of this metric.
Creating a Service
- In the Nobl9 web application, click Catalog in the left sidebar, then click the Services tab on top
- Click the plus (+) button to add a Service
- Select the
workshopproject we created earlier - In Display name, type
PetSite-FrontEnd - Click Add Service
Analyzing the SLI
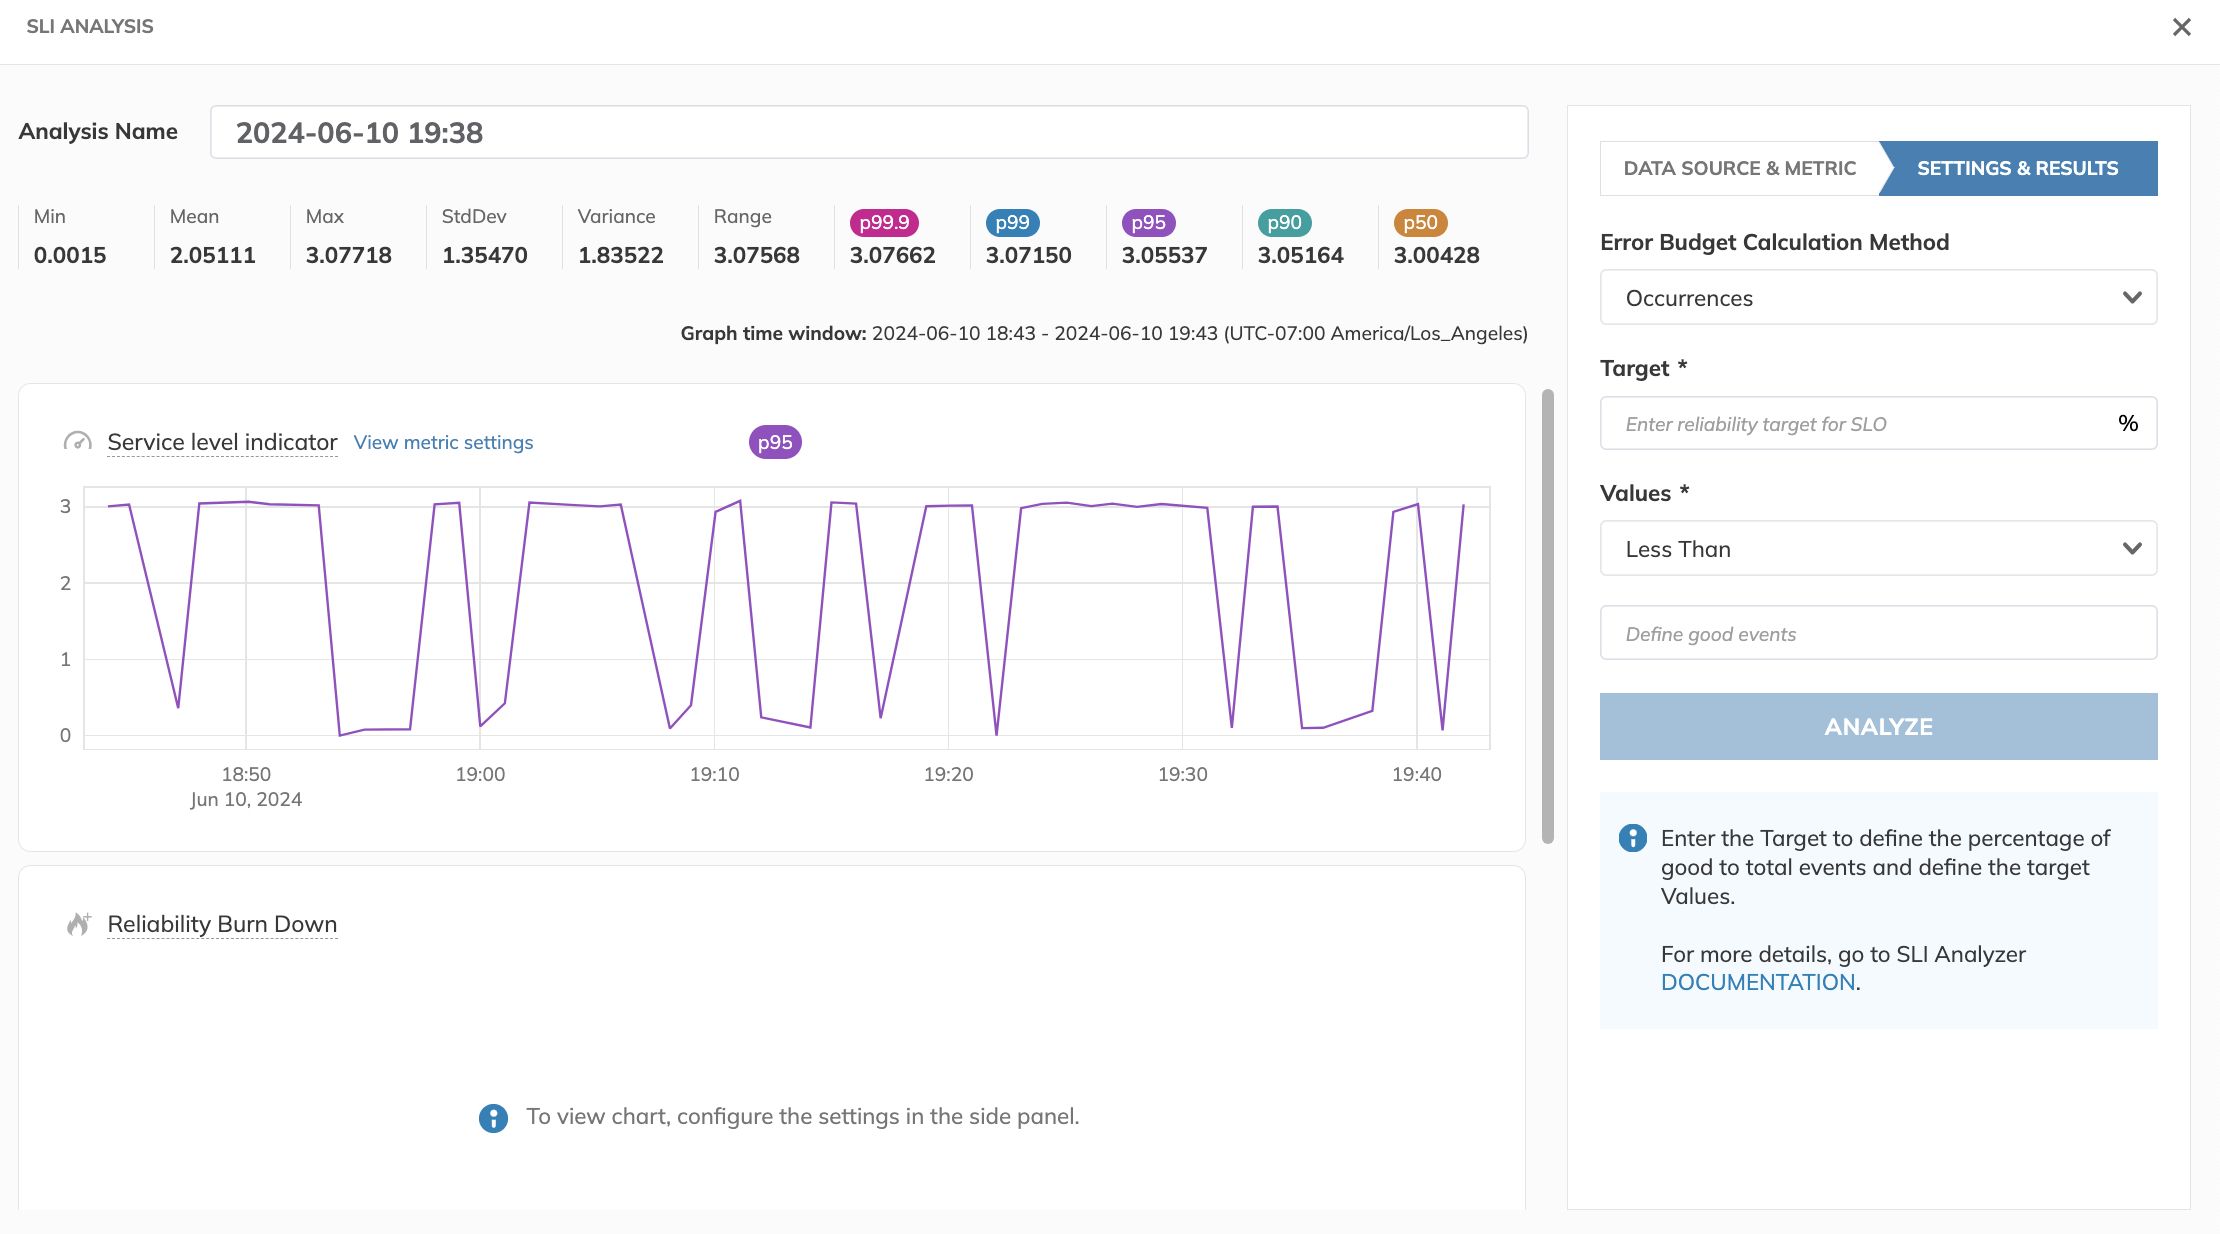
- In the left sidebar, slick SLI Analyzer and click the plus (+) button to create a new analysis
- Pull down the Data Source menu and select your CloudWatch data source
- Under Metric, we’ll leave the tab on Threshold Metric and fill out the fields using the values that we found in the CloudWatch Edit Details screen:
- Account ID
- Region
- Namespace
- Metric Name
- For Statistic Function, choose
p99- Setting your SLO on a high percentile of latency like this can be more effective than setting it on average latency, because averaging the durations of requests has a tendency to hide the slowness that a small but significant number of users may be experiencing.
- For the next two fields, use the plus (+) button to add dimensions:
- Key:
TargetGroupValue: copy and paste from CloudWatch Edit Details - Key:
LoadBalancerValue: copy and paste from CloudWatch Edit Details
- Key:
- For Graph Time Window, choose
1 hour(unless you know you have more data than that in your account) - Click Import Data
This will take a couple minutes to import the data from CloudWatch.
Once the data is imported, you can experiment with different values for the Target and Threshold of your SLO. In my environment, I went with:
- Target:
99 - Threshold:
3.071
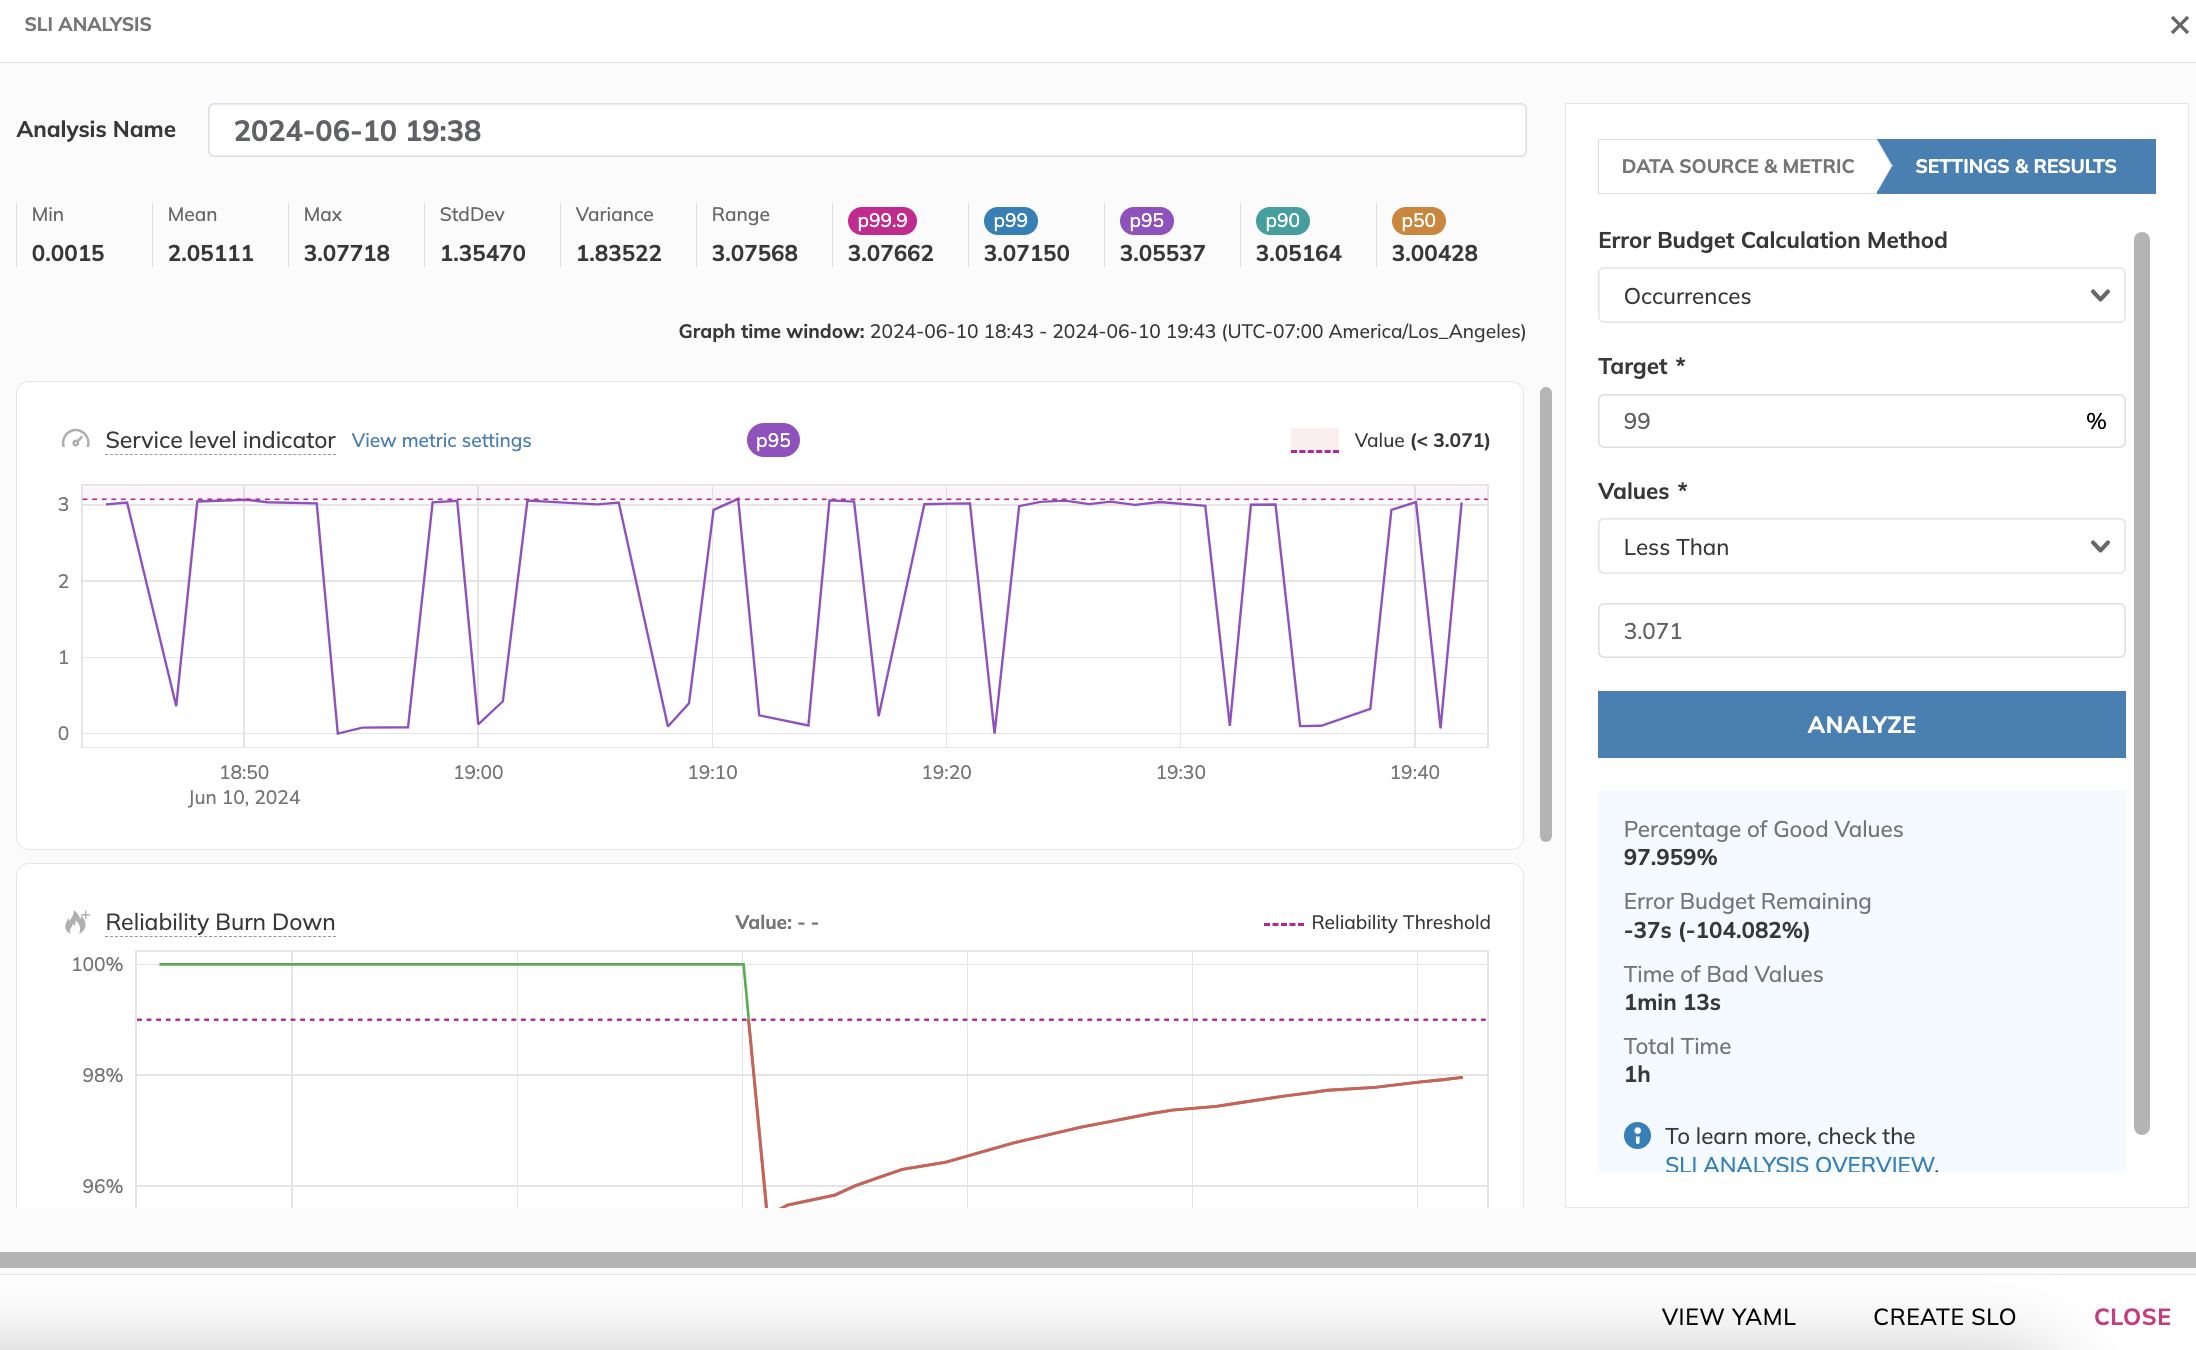
But your application’s performance may differ, and you may want to play around with different values to see how the SLO would behave. Once you’re satisfied, let’s move on to the next step of creating an SLO from this Analysis.